"Bottom" & 4 Major Bases from Macro
- Name
- The Datafi
- Published on
- · 9 min read
Author: The Datafi
Published on April 2023
Summary: Discovering the correlation between stablecoin supply and the Fed fund rate; Projecting the peak of interest rates in 2023; 3 macro indicators pointing to market cycles; and useful yet basic knowledge for cryptocurrency investors.
In February 2023, the DataFi team released a report titled "Big Signal 1," discussing the determination of whether BTC had hit bottom or not. Once again, we have made new discoveries about the correlation between market growth and macroeconomic factors, along with projecting the peak of the Fed Fund Rate in 2023. Let's delve into this together.
Note on the term "Bottom" in the context of the article: It refers to a phase with a low price range before reversing into a new upward market cycle.
>> Research team
DataFi's research analyst team, including Andrew and Rosy.
DataFi still hopes to receive feedback from readers' views to make further progress. Please send any comments to:
- Admin Rosy (telegram)
- Facebook / Twitter DataFi
- Email: thedatafi@gmail.com
Best regards,

Andrew and Rosy (from left to right).
I. Stablecoins vs Fed Fund Rate
In this paper, we want to share with readers a new insight also related to liquidity - that is stablecoin - one of the important "gateway" connecting conventional cash flow into the crypto sector, reflecting investment demands and overall liquidity.
The question is, how do stablecoins respond to Fed tightening or easing? Do they have any correlation? Let’s explore thoroughly historical data below, showcasing the correlation between the Fed Fund Rate and the market capitalization of 5 major stablecoins (USDT, USDC, DAI, TUSD, BUSD):

Stablecoins capitalization growth (log scale) in quantitative easing/tightening (QE/QT) cycles. Source: Synthetic Datafi
For better understanding, our team will divide the above chart through 2 economic phases: QE (Quantitative Easing) and QT (Quantitative Tightening):
QT stage:
This is when the Fed rapidly increases interest rates to direct cash flow back to the banking system, leading to a reduction in liquidity.
The 2 recent tightening phases include 2015-2019 and 2022 onwards. Although both involve rate hikes, the growth in stablecoin usage differs. The coexistence of “2 conflicting trends within the same economic state” can be partly explained by market scale:
2015 - 2019 (Phase 1): The capitalization of stablecoins (primarily USDT) and the Fed interest rate displayed a parallel growth pattern. The reason was the relatively small size of the crypto market (less than $10B), making it easier for capital inflow, and the small market scale might limit the impact of macro capital on crypto.
2022-present (Phase 2): The capitalization of stablecoins and the Fed fund rate move in opposite directions. This is due to the market scale having grown over 100 times (over $1T) and crypto market developments aligned more similarly with macroeconomic trends. (observe the linear chart below)
QE Phase:
In contrast to QT, QE is a period where the Fed fund rate decreases, increasing the money supply in the market. During the period from 2019 to 2022, when the Fed fund rate approached 0%, it created favorable conditions for risk assets like crypto to grow. During this time, in just two years (from 03/2020 to 04/2022), the total market capitalization of stablecoins in the crypto market grew over 32 times (from $5B to over $160B). This marked the beginning of the extraordinary growth phase of the market during that time.

Growth in capitalization of stablecoins (linear scale) during quantitative easing/tightening (QE/QT) cycles. Source: Synthetic Datafi
→ In short: Where will the Fed fund rate peak so we can imagine how long the stablecoin supply in the market will decrease? The answer can be found in section 2 below.
II. The Fed Forecasts
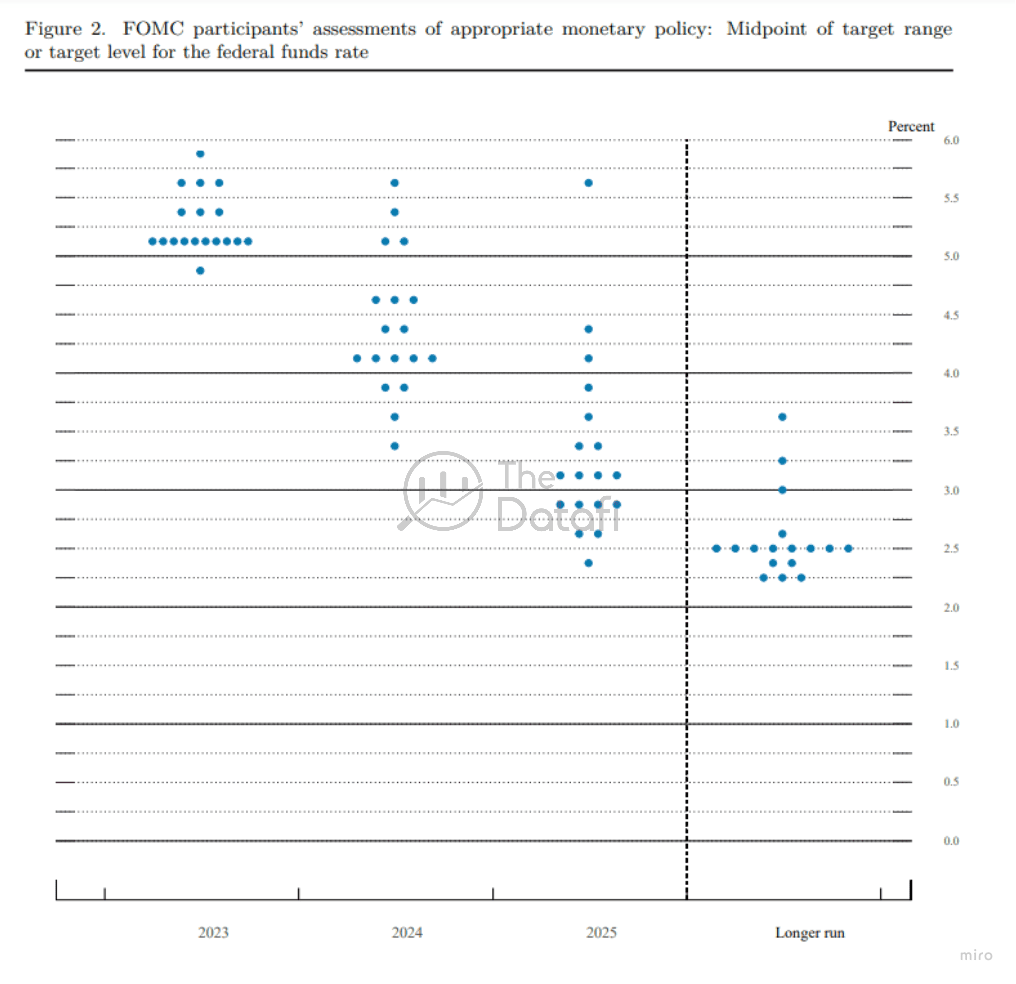
We use the dot plot (the Fed's survey of expected interest rates from members of the FOMC meeting) from the last FOMC meeting report to find out.
The data shows: There are 10 out of 18 members attending the meeting, or more than 50%, think that the Fed's overnight interest rate in 2023 may stop at 5.25%, or in a less positive case, it can be up to 5.5% or 5.75%.
Credit in the US is also being tightened, which means that the Fed is both lending to banks at higher interest rates and not allowing banks to disburse as "easily" as before. If interest rates continue to increase, it will profoundly affect the US banking system.
On the other hand, the prices of many goods in the US are now stable, the CPI in April is only 5% (6% last month) which is a good sign so that the Fed won't have to raise interest rates as many times as before. So maybe 5.25% is a reasonable interest rate for 2023 and may decrease gradually in the following years.
III. Market Cycle Indicators
In a weekly report of the DataFi team ( CDOC.08-special issue February 18, 2023), we have suggested that the market may have bottomed out, specifically through 3 major indicators such as:
(1) The 65-month cycle of global liquidity (Global Liquidity Cycle)
→ Summary: “we are at the bottom of the low liquidity zone before the market recovers to the high liquidity zone”.
(2) Inverse yield curve (US 2-year/10-year bond)
→ Summary: “The market has woken up to the possibility of a recession in 2023, the possibility of this recession is very high because short-term bond interest rates are higher than long-term ones".
(3) Market Cycle
→ Summary: “Most likely BTC price is extremely “undervalued” and we seem to have reached the bottom of the old cycle.”
Here is a quote from the CDOC.08 report needed for this topic:
There are 3 points worth noting from the report as follows:
(1) The 65-month cycle of global liquidity (Global Liquidity Cycle)
A very interesting statistic from the report: The GLI index which is a measure of market liquidity, follows a relative cycle of 65 months (about 6 years) with 2 important milestones:.
- GLI index >80%: global market with high liquidity (easy to buy/sell assets)
- GLI index <20%: poor liquidity (hard to buy/sell assets).
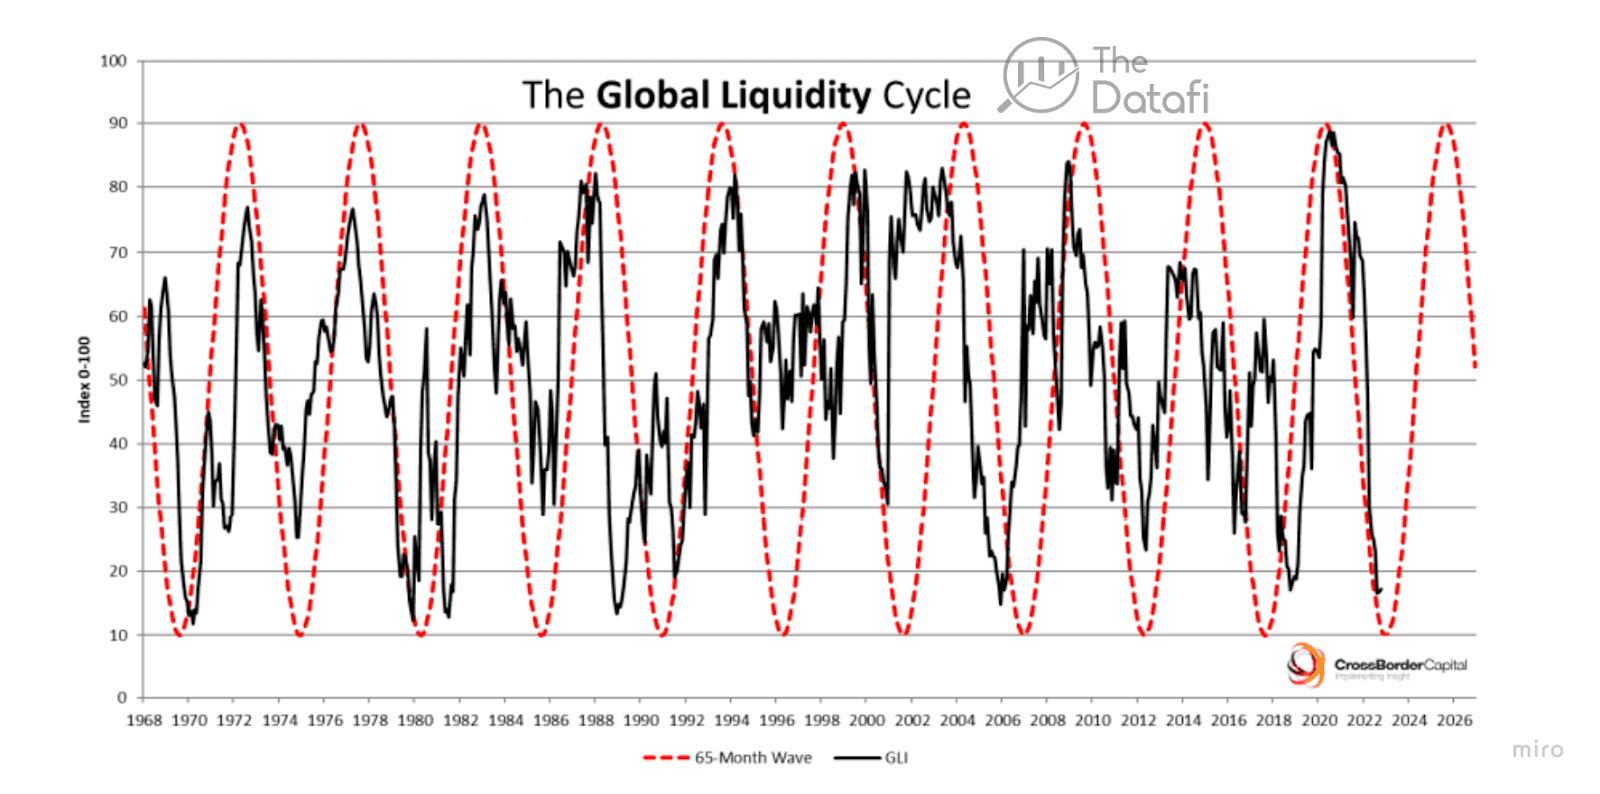
Looking back at previous periods of illiquidity (GLI <= 30%), we see that there is a high probability of major economic crises such as the period 1973-1975, 1999-2000, 2007-2008. These periods also marked the "bottoms" of many asset classes.
Currently, GLI is at 20% (an extremely low level), which coincidentally coincides with the bottom of a 65-month liquidity cycle. This suggests that we are at the bottom of the low liquidity zone before the market recovers to the high liquidity zone.
(2) Inverse yield curve (US 2-year/10-year bond)
Basically, “the inverse yield curve occurs when short-term bond yields are higher than long-term bond yields.”
The high short-term interest rate shows that:
- Bond issuers need to increase short-term capital mobilization.
- It can also reflect a negative view of the economic prospect or the instability of the economy in the long run (that's why they accept higher interest payments to investors in short-term bonds and are not interested in them). long-term borrowing).
The inverse yield curve is often used as a leading indicator in economics, talking about the early detection of economic crises.
Thus, when looking at the figure below, we can see that the yield on the US 2-year (short-term) bond is 50 points (0.5%) higher than the 10-year (long-term) bond yield, combined with the system, mentioned in the GLI section, which warns the probability of an economic recession in the US (*), it can be said that the possibility of a recession in 2023 is very high.
(* BB Economics Probability of US Recession)

(3) Market Cycle
So where are we in the crypto market cycle?
In previous cycles, the local low of BTC in each cycle would have been at the 200-week moving average which is known as MA200. However, at the moment BTC price is already below the 200-Day Moving Average. If “history repeats” then this phenomenon shows that BTC price is extremely “undervalued” and we seem to have reached the bottom of the old cycle.

We all know that there will be many opinions on the question of “where is the market really?” Although our team personally does not attach great importance to determining the bottom, from the lack of liquidity in the global market, as well as concerns about the "sub-recession" story this year, we believe that 2023 is still here. It will be a challenging year for the financial market in general and the cryptocurrency market in particular. At the same time, 2023 will also be the prime time for investors to build a promising portfolio for the period 2024-2025 when the market has shown some signs of a cycle such as BTC price getting below 200-week MA** .**
IV. Summary
With 3 bases:
- The forecast from the FOMC dot plot shows that the "peak" of the Fed fund rate is also approximately close, the interest rate is expected to decrease in the coming years and in the long term it may be at 2.5%.
- Stablecoin supply correlation bounces back immensely as interest rates reverse.
- The market may have bottomed
then we can expect large cash flow to return to the financial market in general and the cryptocurrency market in particular in 2024-2025 when the economic context is more positive and the Fed interest rates are "cooled down" gradually.
However, another view on investment that the DataFi team wants to share with readers is that it is difficult for us to know where the top-bottom is, the forecast is just a forecast. There are signs/indicators that are tools to be able to complete an investment plan more confidently, but that is not all, DCA is still a good way because maybe the really dark day has not come yet?
Finally, we would like to wish you a new journey with many lessons and achievements!
And don't forget to look for more insights and opportunities in other research of our team such as Narrative, Venture Capital, and Money Flow which were just published in April 2023.
Thank you, dear readers!
Disclaimer: This article does not aim to provide financial investment advice.