Subterranean Currents and Upcoming Opportunity
- Name
- The Datafi
- Published on
- · 12 min read
Author: The Datafi
Published on: April 2023
Summary: It was seemingly thought that without capital pouring into the market, the recovery phase would be absent. Predictions of the market were made based on borrow/health rate, and borrowing was seen as a positive move. But is this true? What is the capital flow alteration between ecosystems after a year? Which categories are attracting capital?
In this report, the DataFi team’s objective is to share our perspective on capital flows in the Crypto market over the past period. This perspective originates from questions posed by investors:
- Is the price growth of BTC and altcoins in Q1 2023 sustainable? What's the source of this price surge?
- Can market growth be predicted based on lending flows (borrowing, health rate)? Why is the lending sector not as active as before?
- Looking back over the past year, what's special about the changes in capital flows and trading volume on DEXs across ecosystems?
- Which categories are attracting capital?
_____________
The Research Analyst Team of DataFi, including: Tian, and Rosy.
For Further Progress: DataFi hopes to receive feedback from our readers. Contact:
- Admin Rosy (telegram)
- Facebook / Twitter DataFi
- Email: thedatafi@gmail.com
Best regards,

Tian and Rosy (from left to right).
I. THE SOURCE OF MARKET GROWTH
We will explain why BTC made a strong recovery (surging more than 85% from the bottom of 15kxxx in November 2022). Is this rise sustainable? What's the source of this growth? Specifically:
In the period from April 2022 to December 2022, investor sentiment was fearful, leading to an increase in stablecoin dominance from 8% to 17%.

Above Chart: Total market cap.
Below Chart: Stablecoin supplies and Stablecoin.Dominance. Source: Tradingview
Stablecoin dominance rise also indicates better liquidity, and projects will return/already returned to their true value. Simultaneously, holding more cash increases the possibility of price increases during recovery.
Consequence: By the beginning of 2023, BTC and altcoins had a strong recovery, with the total market cap growing. During this period, stablecoin supply decreased by 21% (compared to the highest point in April 2022). Therefore, it can be said that the recent growth was mainly fueled by investors using stablecoins which are available in the market to buy tokens.
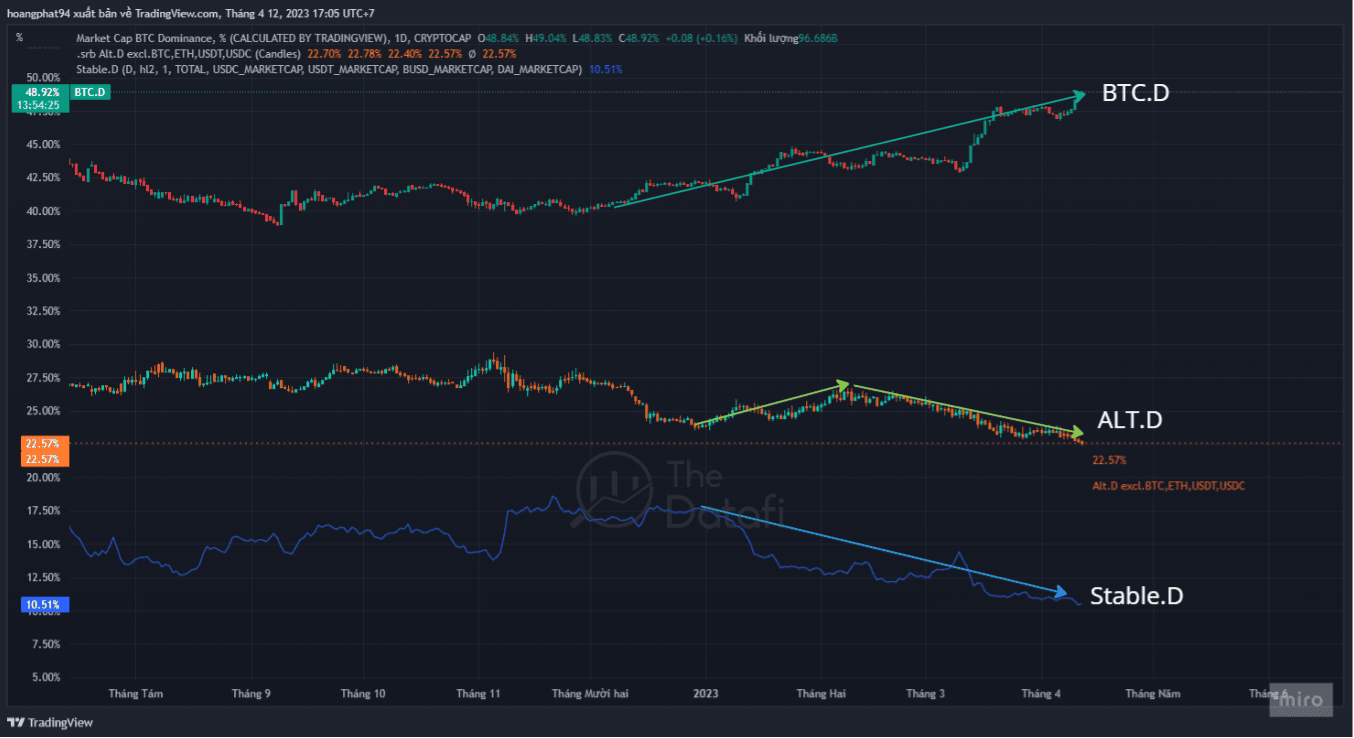
Dominance of BTC.D, Alt.D, Stablecoin.D. Source: Tradingview, processed by DataFi.
Overall, investors were more optimistic, signaling positive trends. However, this growth may not be sustainable until new capital flows into the market.
II. IDENTIFYING UPTRENDS
In this section, we will explore whether "market growth can be predicted based on borrowing behavior (borrow, health rate) on lending platforms, as many believe."
Assumptions:
Pessimistic investors will: decrease in borrowing stablecoins for investment (deposits and borrow decrease) or increase in borrowing for shorting (utilization increases).
Optimistic investors who expect future schemes for price rise will: Accept higher risk, leading to an increase in collateral (deposits and utilization increase) for borrowing more stablecoins with a lower health rate.
Taking the major protocol AAVE as an example, we divided the period from January 2021 to April 2023 into 5 phases based on changes in deposit, borrow, utilization on AAVE V2, and BTC price movements.

Deposit supply & Borrows over time on Aave V2 Ethereum Source: Dune (@echolon166), edited by DataFi.
Based on the provided information, let's break down the analysis:
Note:
- NĐT: Investor;
- Deposit supply: The collateral funds deposited into the protocol;
- Borrows: The funds borrowed (for purchasing tokens, shorting, or other purposes);
- Utilization Rate: The proportion of the borrowed amount compared to the total amount available for lending in the market.

The question is: If Utilization increases in Phase A and leads to an uptrend in Phase B, then if Utilization increases in Phase D, what will the subsequent market phase look like? At this point, are investors utilizing loans to accumulate assets, short-sell, or pursue other objectives? Before answering, we will review Phase A.
In Phase A, the predominant borrowing is in Stablecoin (91%), excluding the possibility of borrowing other tokens, assuming the initial sentiment of investors is not negative. Therefore, the remaining scenario is borrowing to purchase tokens or for other purposes.
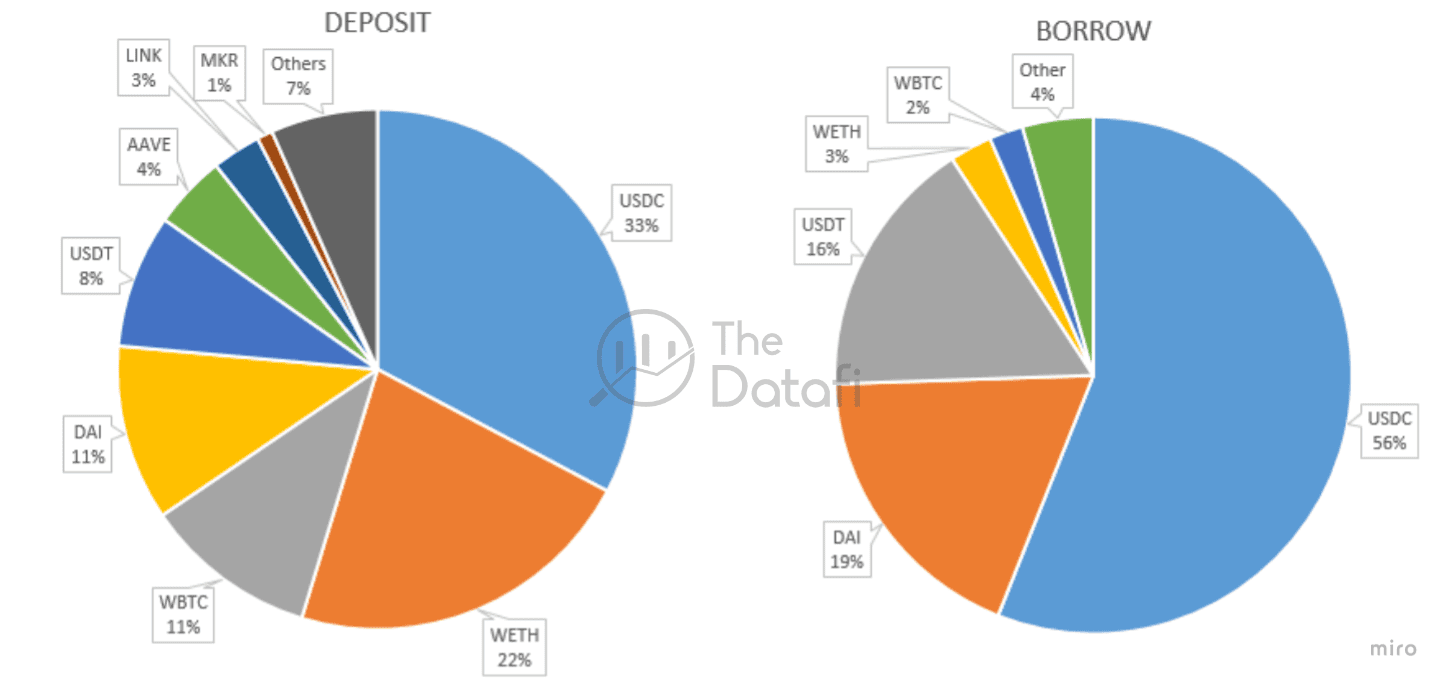
Data regarding Deposit and Borrow based on assets in Aave V2 on the Ethereum network as of July 10, 2021. Source: Dune (@echolon166), supplemented and edited by DataFi.
The issue lies here: from April 2021 to July 2021, AAVE V2 ran a campaign to "encourage liquidity supply and rewards for borrowing stablecoins," causing the demand for borrowing stablecoins for rewards to increase, not necessarily for genuine needs (borrowing to purchase tokens).
When considering Loan Outstanding (unpaid loans) during the period from April 2021 to July 2021, it can be observed that there was a shift of borrowers from the Compound platform to the AAVE platform, which contributed to an increase in both Deposit and Borrow volumes.

Loan Outstanding. Source: CoinmarketCap, Dune (@drethereum), edited and noted by Datafi.
However, to determine whether the increase in Utilization is due to borrowing for purchasing tokens or simply for rewards, specific data is required. Unfortunately, we lack this kind of data, specifically, the percentage breakdown of the 91% borrowed stablecoins indicating how much is for rewards and how much is for token purchases. In other words, the increase in borrow and Utilization may not fully reflect the market's accumulation demand.
→ In summary, relying on the Health Rate strategy to predict market growth is not accurate, and even appears to lag, as demonstrated in the provided chart. Possibly, the Health Rate might be more suitable for forecasting a "diminishing market impetus and the need for supplementary funds from borrowing" (when entering a downtrend, AAVE promotes borrowing of rewarding stablecoins).
So, are there any other ways to identify signs of market growth? The DataFi team has found a more feasible answer for the goal of identifying market growth signals, which is to observe Stablecoin Dominance and the price situation at that time. Below is an example:
Starting from the beginning of May 2022, the Total Value Locked (TVL) of the entire market sharply declined due to the collapse of Terra - a rupture in the DeFi lending system. However, during that period, the supply of stablecoins (Mcap) only slightly decreased. This implies that a significant portion of stablecoins remained idle in wallets and did not actively participate in yield farming activities. This suggests a substantial amount of idle funds within users’ wallets or exchange-held balances.
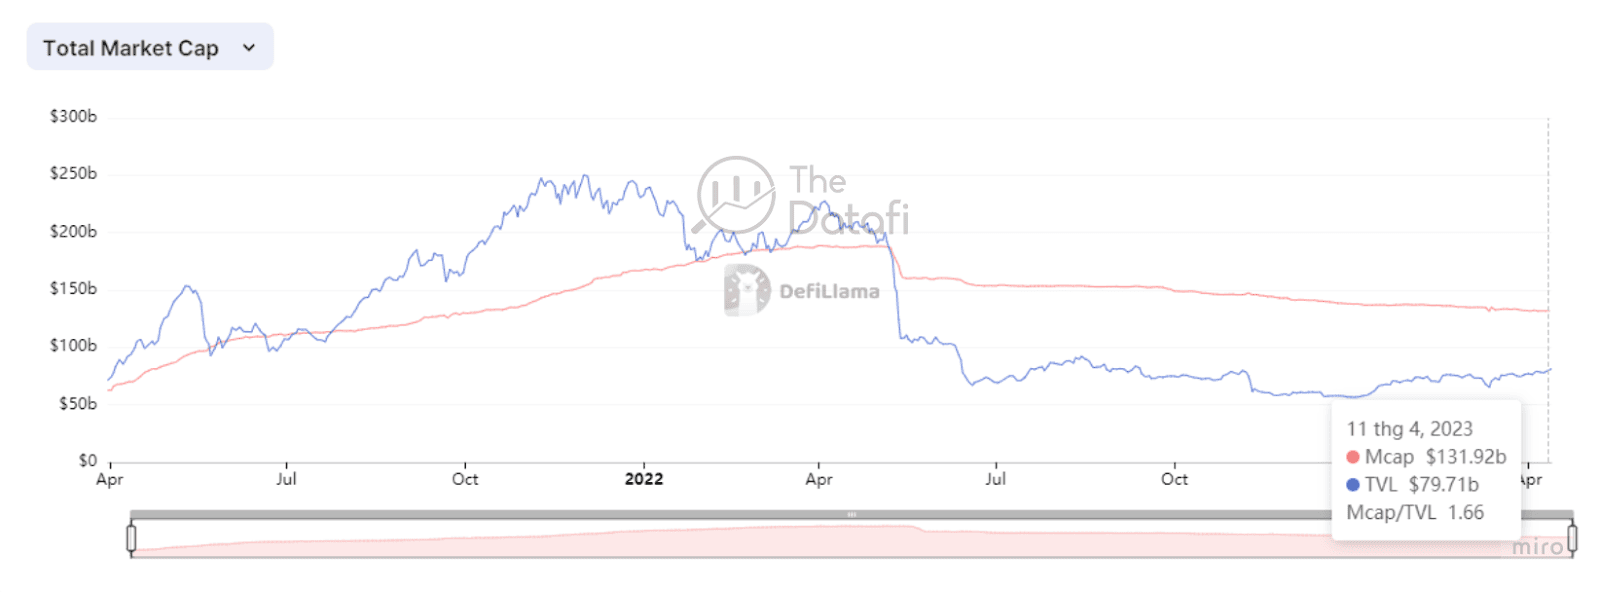
Red line: Market Cap of stablecoin; Blue line: Total Value Locked (TVL) of the market.
Source: Defillama.
At that time, Stablecoin Dominance was around 12%, gradually increasing to 17% and maintaining that level until the end of 2022. Meanwhile, the market share of BTC and Altcoins decreased gradually until around late December 2022 - early January 2023 when all three started fluctuating. During this period, the supply of stablecoins continued to flow out of the market. So, where did the money come from for the market to experience strong growth again in the first quarter of 2023? The answer echoes what was mentioned in (I) and once again aligns with the observation about the surplus idle money: utilizing the existing money within the market for buying, meaning this money is sufficient to drive up prices without needing additional borrowing or introducing new funds.
→ To sum up: By examining the market share of BTC - Stablecoin - Altcoin, it's possible to determine a trading strategy. Coupled with the fact that there have been considerable BTC sell-offs, this could be a good time for accumulating assets. The specific assets to accumulate would depend on the “market pain”(*), which trend needs to emerge, and how to heal.
(*) This market pain could be:
- The collapse of Celsius, FTX-Alameda, and the decline of major ecosystems/projects (CELO, NEAR, ICP, etc.) - loss of trust in older technology.
→ The remedy could be: new ecosystems (Arbitrum, zkSync, Aptos, Sui, Starknet, Optimism, etc.). You can track TVL changes via Defillama to grasp these trends.
- The vanish of Terra (UST) - a crack in Lending (Defi)
→ The remedy could be: breakthrough solutions that fulfill the unfinished mission of Defi - "creating a comprehensive financial system." According to a study by Bis.org, to make lending more efficient, the market needs more centralization - coupled with framework regulations, specifically user identification to enable borrowers to collateralize real assets and ensure the accuracy of data provided by Oracle.
→ And who knows, NFT lending might be the next narrative to unfold to take over RWA? These are suggestions for your consideration.
__________
Some thoughts on the sidelines while investigating the BTC price chart and Aave V2's campaigns:
You might wonder why Aave V2 initiated the incentivized stablecoin lending program in April 2021, right around the peak of BTC. Then, why did it end in July 2021, followed by an uptrend in early August 2021?
The repayment deadline for the loans was July 2021. The majority of these repayments were in stablecoins, meaning borrowers had to sell their purchased assets for stablecoins to repay their debts, while the market kept experiencing continuous dumps from the time of borrowing to repayment. Do you think borrowers were likely to be profitable during the period before July? And when borrowers were facing interest payments and losses, who were the ones with both funds and tokens to pump the market during the subsequent uptrend?
III. WHERE IS THE CAPITAL FLOWING?
Note: quickly read through section 1 to get to the intriguing part in section 2.
Money Flow Across Ecosystems
In general, we observe changes in cash flow among ecosystems as follows:
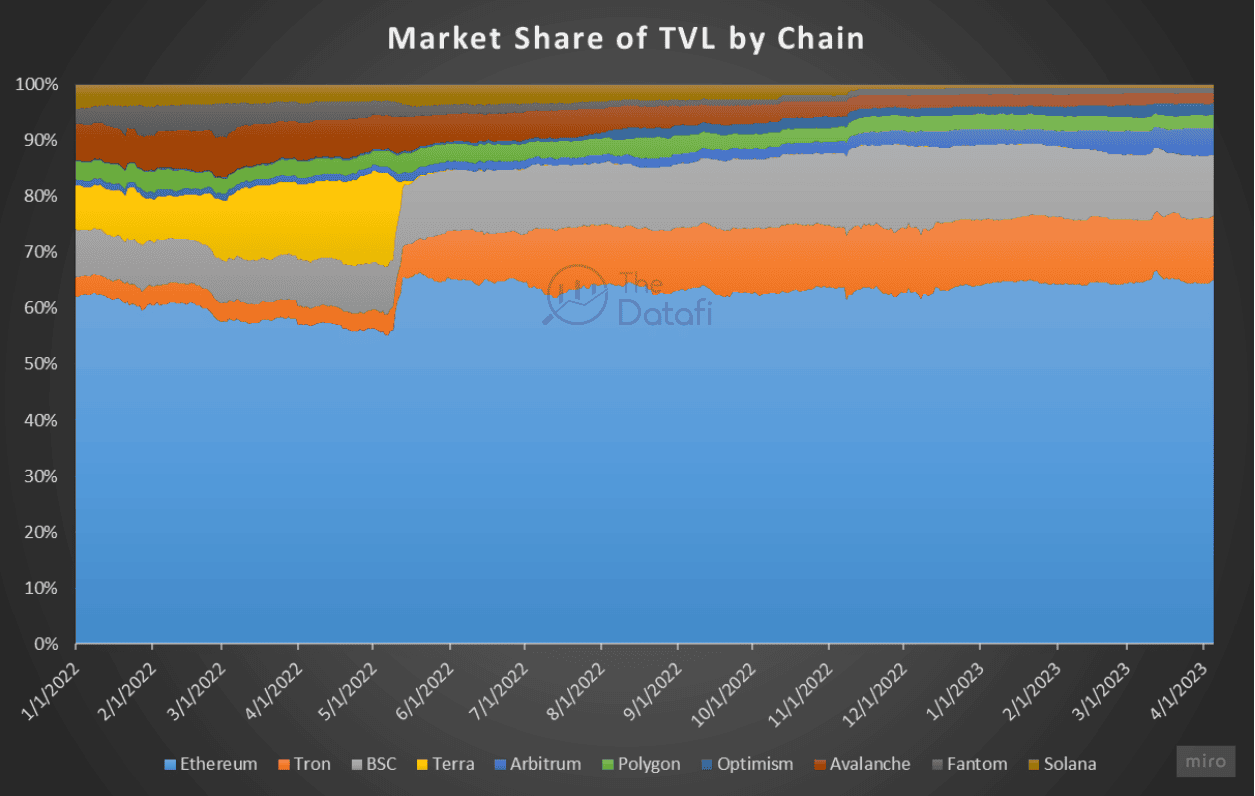
- After the collapse of Terra, the TVL market share almost entirely resides in four ecosystems: Ethereum, BNB Chain, Tron, and Polygon. They increased from 77% (01/01/2022) to 90% (current).
- Moreover, new ecosystems are experiencing gradual TVL growth, such as Optimism +211% and Arbitrum +51%.
Considering the trading volume on DEXes across ecosystems, we also notice specific changes:
- Arbitrum is the ecosystem with the fastest-growing trading volume: increasing from 1.8% to 24.4% of the market share of DEX trading volume.
- Despite maintaining TVL, BNB Chain's on-chain trading volume has decreased by more than half, from 26.5% to 10.5%.
- Furthermore, Ethereum, although still the "playground" with the largest trading volume on DEX, has started conceding a small portion of market share to Arbitrum around March 2023.

Seizing opportunities in money flow among ecosystems isn't too difficult. We can track TVL changes or other metrics and follow the narratives.
Money Flow Within Categories
Regarding money flow within specific fields, let's focus on the first quarter.2023. The statistics below reveal a general TVL growth across the entire market, from $46.72 billion to $61.69 billion (a 32% increase), and growth across all categories.

TVL in the first quarter.2023 vs. the last quarter.2022 by Categories.
Source: Defillama, chart by DataFi
As mentioned in part (I), money is continuously flowing out of the market. So, the growth of TVL in these categories is not just due to an increase in price or available funds pouring into the market. Could there be shifts from one category to another? The answer is "no" when considering the growth in TVL value.
However, there is a shift in market share among specific categories. Dexes have decreased while Lending and Bridge have risen. This shift isn't necessarily about withdrawing TVL from DEX to transfer to these two categories. It could be attributed to the impermanent loss being the primary factor causing the TVL market share of Dex to lag behind Lending and Bridge as token prices rise. On the other hand, Bridge benefits from the competition among ecosystems, as well as the regular money flow shifting through Bridge due to hunting for Airdrops in new ecosystems.

Changes in TVL Category Market Share in DeFi - Q1.2023. Source: Defillama, chart by DataFi.
Interestingly, within the Top 10 categories, there's a new name: NFT Lending. Its TVL has risen strongly to $378 million, growing by ~140%. Considering the estimated market cap of the top 4 NFT collections (BAYC, Cryptopunks, Azuki, MAYC) which currently stands at 1.7M ETH ($3.3 billion), the TVL of the NFT Lending sector is still relatively marginal.
Returning to the lending story in section (II), Bis.org mentions the encoding of real-world assets. Could NFT lending be a step forward before that happens? From DataFi's perspective, significant real-world assets can only be digitized with approval from the governments. This doesn't seem to be easily achieved immediately; it's a big game, a big challenge and requires substantial operational machinery to be ready to digitize real-world assets later.
For a deeper understanding of the NFT lending topic, you can refer to our research in the first quarter.2023 - Narrative report. Additionally, when discussing money flow, the research on BIG SIGNAL 2 by our team shouldn't be missed. It shows the correlation between money flow, the Fed's interest rates, and other signals.
In conclusion, DataFi wishes you a journey filled with both lessons and achievements!
Thank you, dear readers!
Disclaimer: This article does not aim to provide financial investment advice.