A Guide to DataFi Dashboard
- Name
- The Datafi
- Published on
- · 11 min read
This guideline is the general instruction on how to use DataFi Dashboards. Besides, there are some tips as well as sharing about On-Chain knowledge. We believe that you will have some interesting experiences when exploring On-chain Insights and Signals.
If you would like to use the Dashboard, please click “Dashboard” on the menu bar to register, starting on August 3rd, 2023.
Overview
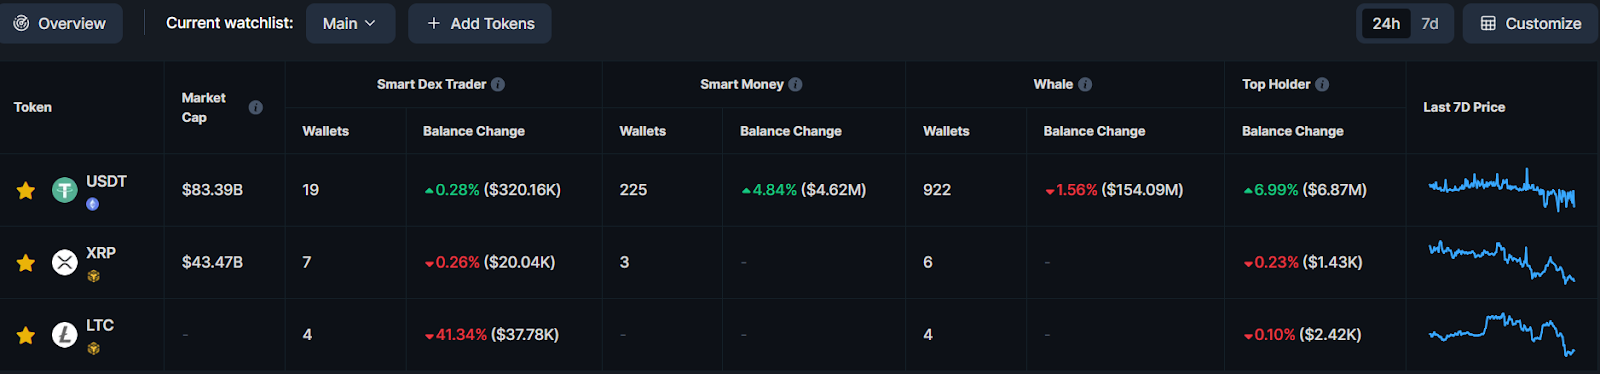
“Overview” shows the general view of the changes in asset portfolios (as known as Balance Change) of some groups of wallets in the last 24 hours (24H) or 7 days (7D). The default sort is based on the descending order of Market Cap.
Increasing balance (Balance Change is positively high) may reflect a bullish sign and vice versa.
Below are the labels that we track:
- Smart Money (SM): Wallets that have outstanding performances and win rates than the overall traders for a long time
- Whale: Wallets that have a more than $1M net worth of total assets in their portfolio. We separated them into 3 sub-labels:
- Whale 1: $50M - $100M
- Whale 2: $20M - $50M
- Whale 3: $1M - $20M
- Dolphin: Wallets that have a more than $100K net worth of total assets in their portfolio. We also had 3 sub-labels as well:
- Dolphin 1: $500K - $1M
- Dolphin 2: $200K - $500K
- Dolphin 3: $100K - $200K
- Smart Dex Trader: Traders who earned the highest profits within 7D
- Top Holder: 100 EOA (External-Owned Account) wallets that hold most of the token you are tracking(already excluded the CEX - MEV - Contract).
Indicator Note:
- Wallets: Number of wallets having the label you are tracking that have a change in their balance
- Balance Change (%): Percentage change in Balance compared to the previous 24H or 7D
- Balance Change ($): USD value of the Balance Change

1. Standard Features
- Filter / Sort: Available data views include 24H / 7D timeframe and sorting feature for each column.
- Customize: You can choose to display or hide any column..

- Watchlist: Create your own watchlist by choosing “New Watchlist”, then “Add Token”, and click the Star icon to choose the token you want
2. Advanced Features (Pro Package only)
“Overview” now includes 2 more views:
Positive Tokens: Tokens that showed positive on-chain signals in the last 24 hours, calculated by our exclusive DataFi metrics. .
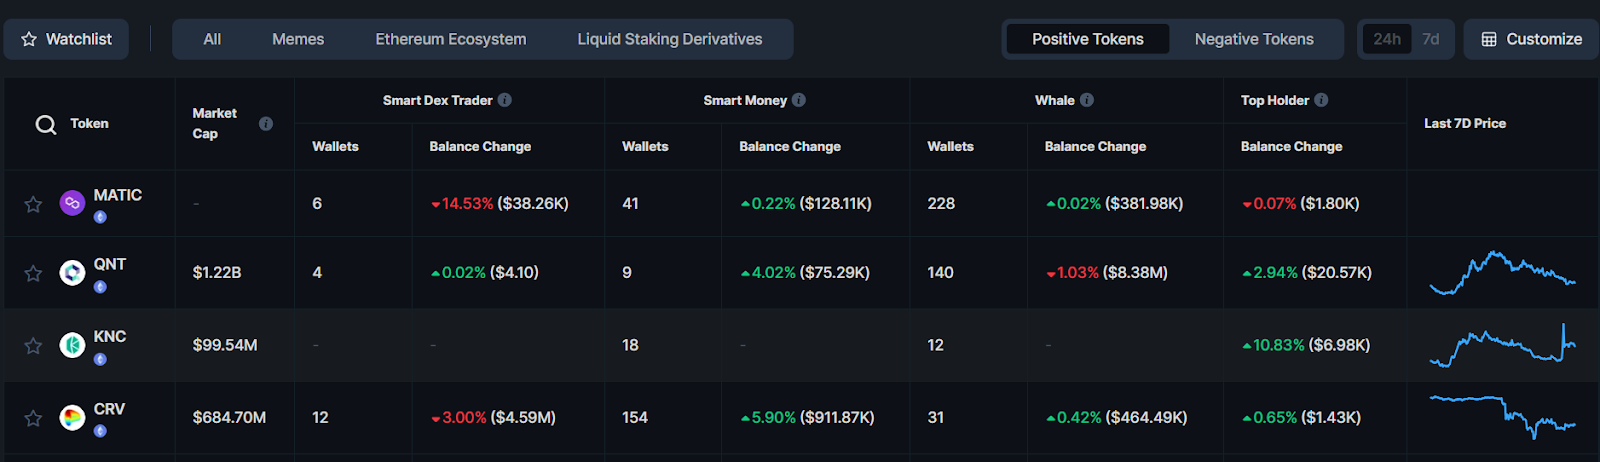
Negative Tokens: In contrast to “Positive Tokens”, they regularly reflect bearish on-chain signs.

Note:
- Price may be impacted soon or may take a little more time. These features are best if combined with other kinds of analysis such as fundamental or technical.
- We are working on this to improve these metrics for next versions.
CEX Netflow
1. Standard Features
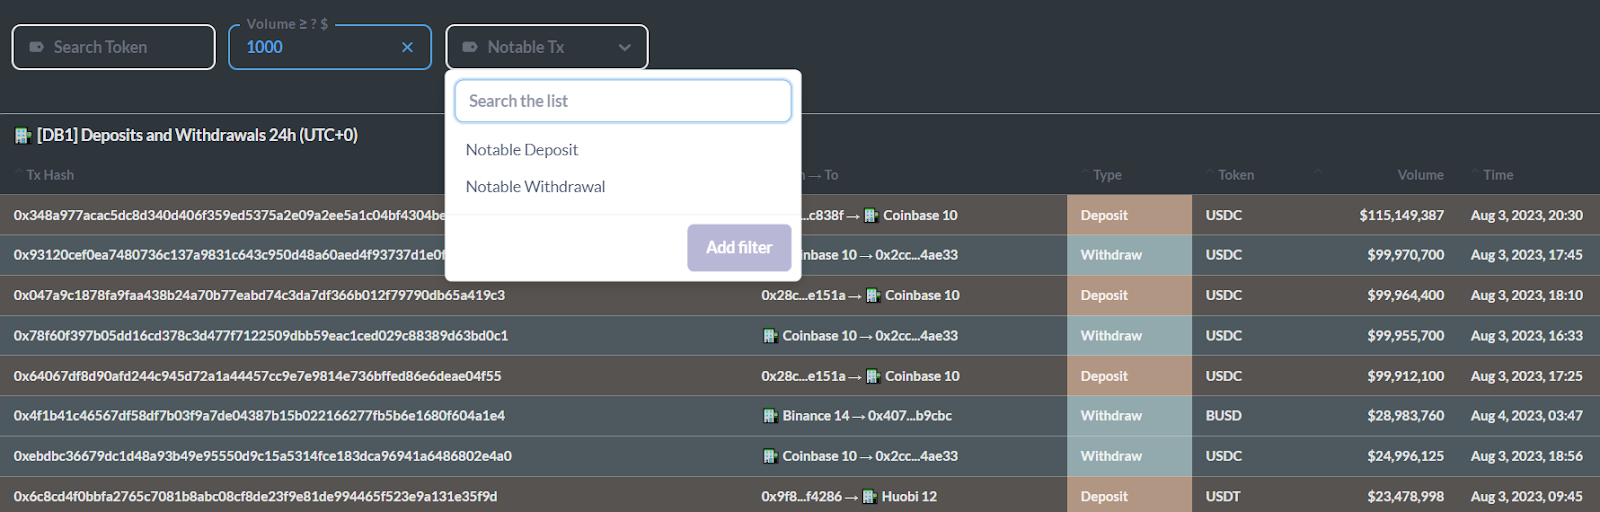
1.1 [DB1] Deposits and Withdrawals 24H
This dashboard shows transactions going in and out of centralized exchanges (CEX) in the last 24 hours.
Below are the metrics used in this dashboard:
- Tx Hash: Transaction hash, used for searching the transaction on blockchain explorers
- From -> To: Sender and receiver
- Type: Categorization of deposits or withdrawals from the CEXs
- Volume: USD value of the token transferred in the transaction
- Time: Time at which the transaction happened
Trial Package allows you to sort any column here in different orders, while Pro Package includes a filter of transactions that are worth noticing and may have impacts on price.

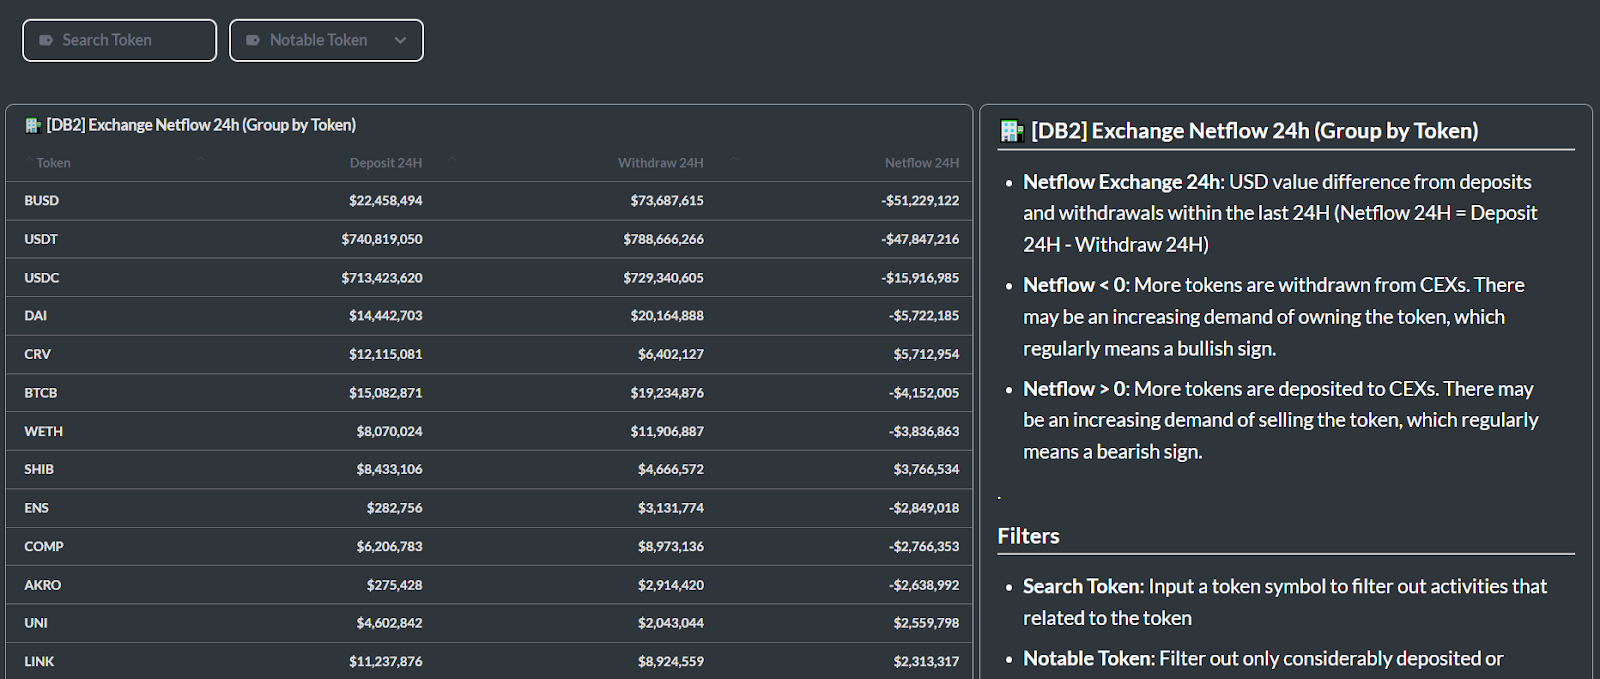
1.2 [DB2] Exchange Netflow 24H (Grouped by Token)
This dashboard shows the Token Inflow and Outflow of CEX.
Below are the metrics used in this dashboard:
- Deposits 24H: USD value transferred to CEXs within the last 24H
- Withdrawn 24H: USD value withdrawn to CEXs within the last 24H
- Netflow Exchange 24H: USD value difference from deposits and withdrawals within the last 24H (Netflow 24H = Deposit 24H - Withdraw 24H)
Trial Package allows you to sort any columns as the previous one, evaluate token when it records Positive or Negative Netflow with simple meaning below:
- Netflow > 0: More tokens are withdrawn from CEXs. There may be an increasing demand for owning the token, which regularly means a bullish sign.
- Netflow < 0: More tokens are deposited to CEXs. There may be an increasing demand for selling the token, which regularly means a bearish sign.
However, this requires a more proficient on-chain knowledge to tell which transactions can impact the price, and also takes more time. Therefore, we provide you with a more convenient feature below.
2. Advanced Features
Advanced filters include searching features and also our DataFi Exclusive Metrics for better insights.

Here are the instructions:
- Search Token: Input a token symbol to filter out activities that related to the token
- Volume ≥ ? ($): Filter out only transactions that have a higher USD value than this value.
- Notable Tx (available for Pro Package): Filter out only considerable deposits or withdrawals.
- Notable Token (available for Pro Package): Filter out only considerably deposited or withdrawn tokens
Smart Money (SM)
This dashboard shows Smart Money’s transactions on Decentralized Exchanges (DEX). These wallets are traders who have better performance and higher win rates than the overall investors or earn considerable profits on DeFi platforms, which can be inferred as their good sense and prediction on crypto trends and price movements.
Number of SMs that we are tracking: 3398 (MEV and Smart Contracts are eliminated). Some other great platforms still include these 2 types in their SM wallets.
1. [DB1] Top Net Trading Volume 7D (Tracked by Token)
This dashboard finds out the top 10 tokens that have the largest absolute net trading volume in the last 7D on DEXs.
Formula: NTV = (Buying Volume - Selling Volume) * Price.
There are 2 cases:
- NTV > 0: More tokens are bought on DEXs than sold, which regularly means a bullish sign
- NTV < 0: More tokens are sold on DEXs than bought, which regularly means a bearish sign
→ You may consider buying tokens that are bought more than sold, or adjust your plans when the assets in your portfolio are being sold more than bought by these Smart Money. Even though you act a little later than them, you can still be quite ahead of the market.

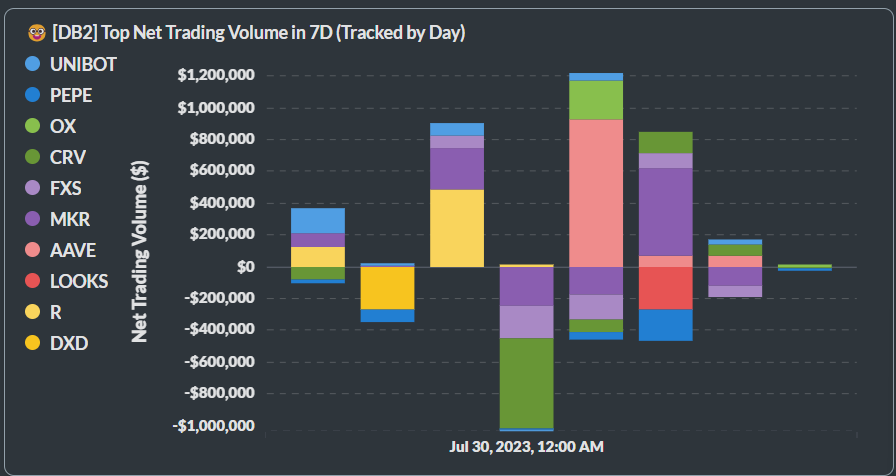
2. [DB2] Top Net Trading Volume in 7D (Tracked by Day)
This dashboard tracks the 7D net trading volume history of the top 10 tokens that have the largest absolute net trading volume in the last 24H on DEXs.
When a token’s net trading volume appears on the later days of the week, the signal will reflect stronger than ones that appear on earlier days.
DEX Trader
1. Overall
This dashboard tracks traders’ performances on Decentralized Exchange (DEX).
Please note: Carefully check the wallet’s historical trades as PnL and ROI are relative figures. This would take more time to look into the wallet but once you discover a truly good trader, everything changes.
Below are the metrics:
- DEX PnL: Estimated Profits and Loss (PnL) of the wallet earned from DEX trades. This calculation includes both realized and unrealized PnL based on trading price and open/close prices within a timeframe.
- DEX ROI: Percentage of DEX PnL
- Win Rate: Number of tokens that the wallet gained profits out of all tokens it trades within a timeframe
- Token Traded: Tokens that are traded by this wallet within a timeframe
- 🤓: Smart Money who made outstanding profits in DeFi
- ⭐: Smart DEX Traders who earned most profits through DEX trades within the previous 7D. These wallets are more likely to perform quick trades, and they can move out their funds to another wallet by any time.
- 🤖: Bot-like wallets with an unusually high number of trades
2. Features
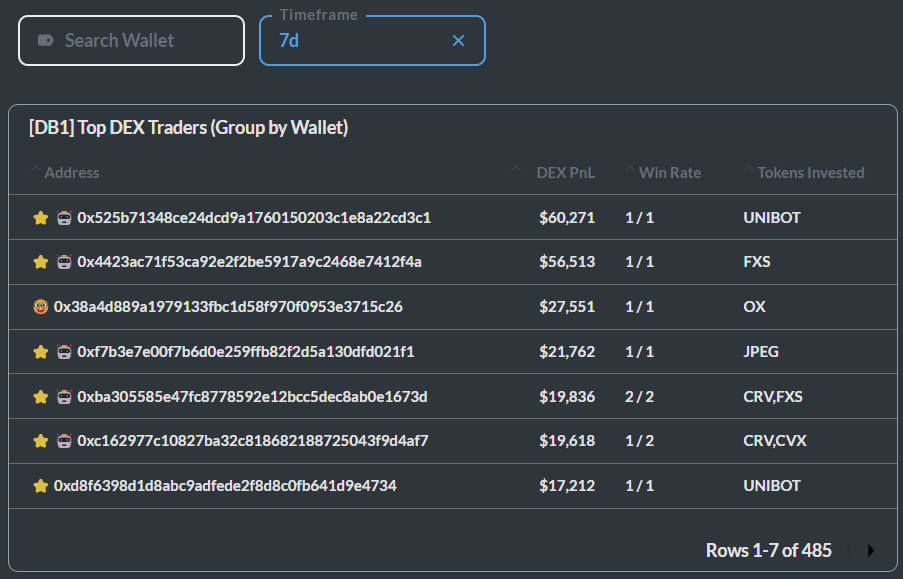
2.1 [DB1] Top DEX Traders (Grouped by Wallet)
This dashboard shows wallets that have greatest DEX performances within a specific timeframe. It can be used to find outstanding wallets.
Here are the features:
- Sort: You can sort the column based on your need.
- Search Wallet: You can find historical trades of the wallet you chose.
- Timeframe: You can choose a specific timeframe in which the performances are tracked. Pro Package would come with larger timeframes.
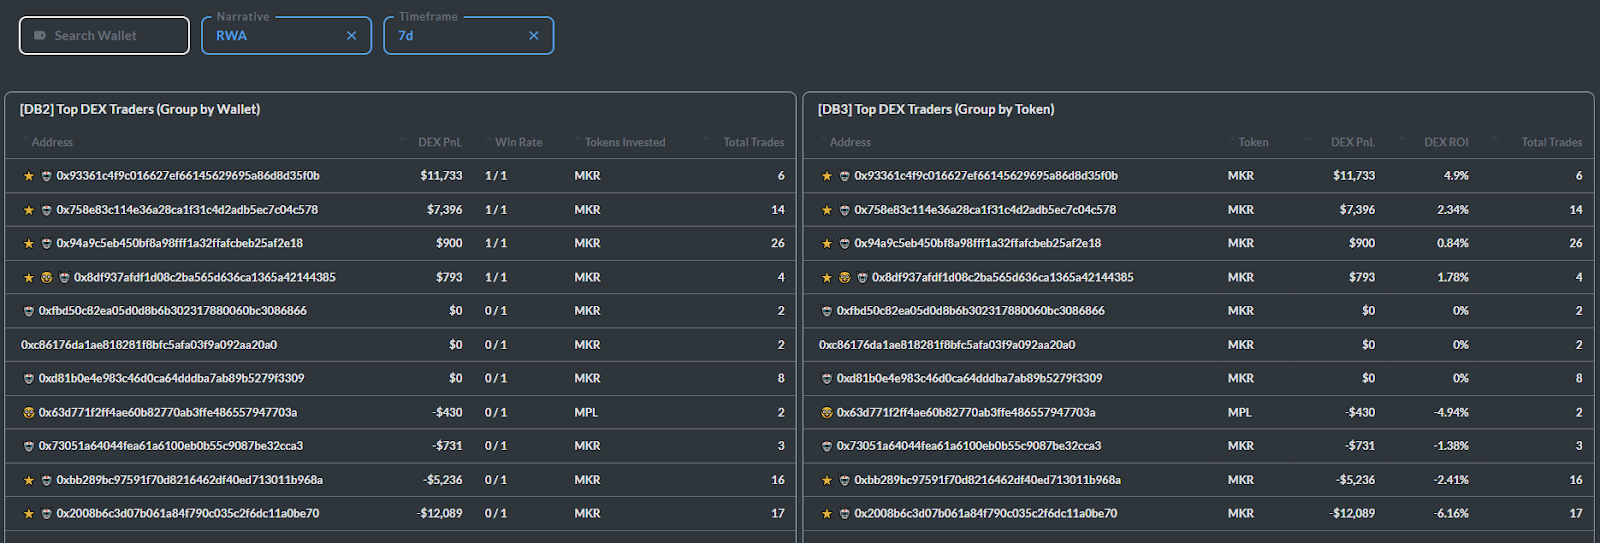
2.2 [DB2] Top DEX Traders (Grouped by Token)
This dashboard shows all DEX performances within a specific timeframe, which can be used to find outstanding trades. Features are similar to the previous dashboard.

3. Smart Dex Trader 7D (SDT7D)
They are traders who made the highest profits within 7D (tracked from T-8 to T-1, with T as the current date).

3.1 [DB3] Top Net Trading Volume 7D (Grouped by Token)
This dashboard works exactly the way Smart Money’s dashboards do. Here you can find 10 tokens that attracted the largest absolute net DEX trading volume within a 7 days timeframe.
3.2 [DB4] Top Net Trading Volume in 7D (Grouped by Day)
This dashboard works in the same way as Smart Money’s dashboards. You can track the 7D net trading volume history of the top 10 tokens that have the largest absolute net trading volume in the last 24H on DEXs.
Narrative
Narrative section entails a compilation of notable tokens extracted from specific popular trends or categories such as DeFi, RWA, and Lending. Additionally, there exists a "Top Watchlist" collection, predominantly interested by the Community.
Please take note that only tokens on ETH and BSC chains are tracked.
Net DEX Trading Volume 14D

Formula: Net Volume = (Buying Volume - Selling Volume) * Price
Here are some guidelines to assist you:
- For example, when you choose RWA as for the Narrative, you will gain insights into the investment behavior of the labeled wallets.
- For tracking trading activities, utilize the search box labeled "Label" to specify the type of wallets you wish to monitor.
Top DEX Traders
Similar to the dashboards tracking DEX Traders, here you can find trading activities in a specific narrative, which would offer a window into good traders’ trading strategies. DataFi has organized this information using 2 dashboards which share the same features and data as Top DEX Trader Dashboards in the previous part.
In the search box labeled "Timeframe", you can opt for either a 1-day or 7-day timeframe.
Should you encounter difficulties in grasping this content, consider referring to our specific on-chain courses for deep-dive understanding and practical strategies.
VI. Hot LPs
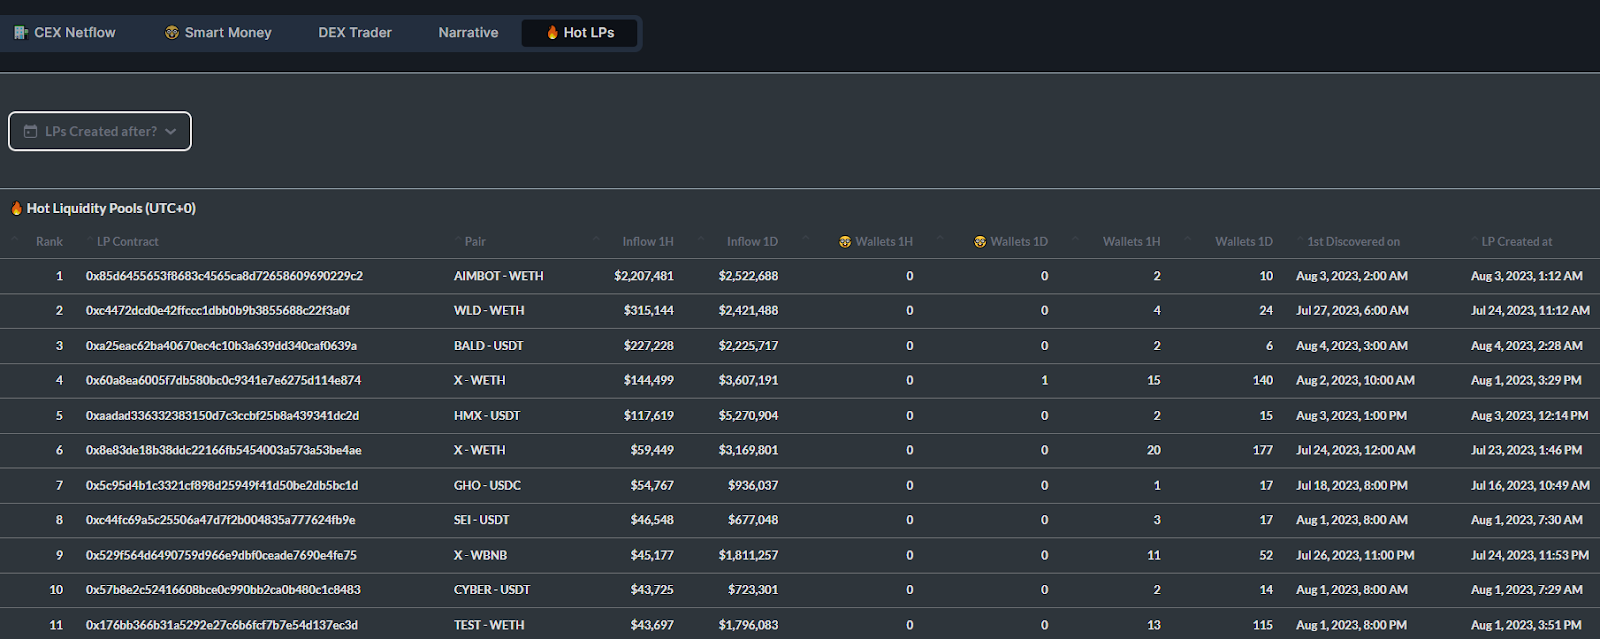
This dashboard is concentrated on Liquidity Pool (LP) Contracts established within the past 30 days, sorted by their descending 1-hour Inflow. By reviewing this data, you have the opportunity to identify potential hidden gems before they gain widespread attention. Your task is to rate them and plan your trading strategy accordingly.
The following metrics are presented:
- Pair: Token symbols of the pair
- Pool: Contract address of the pool
- Inflow: USD value of the tokens transferred to the pool
- Wallets: Number of wallets interacting with the pool
- 🤓 Wallets: Number of Smart Money interacting with the pool
- 1st Discovered on: Time at which the pool first appeared in the top 10
Usage instructions:
- Select a token and examine its "1H/1D Inflow".
- When rating a token, analyze the pool with the highest Smart Money interaction. However, exercise caution as this could potentially be price manipulation or scam contracts.
A vital note:
Beware of potential scams. Scammers might employ tactics like using token A (Fake WETH) to engage Smart Money in pools, then executing a swap with token B on the LP "WETH - B". This can create a false impression that Smart Money itself interacted with that LP, leading to token deficit and price manipulation.
To elaborate, the process is as follows:
- Scammer establishes WETH - B (Real WETH) as Pool 1.
- Fake WETH is sent to the victim in exchange for B.
- Fake transactions are conducted to acquire B.
A real-life example: BALD - WETH (Contract: 0x58417ae2fafF94ba3B89b3Ff5ea64AF3d1658800).
Once again, exercise critical thinking and caution when researching LPs. Avoid investing large volumes and ensure transactions are conducted through official wallets. Make sure you consider the following checks:
- Verify if Smart Money uses Real or Fake WETH to swap B
- Examine detailed information within the Pools (Token Sniffer is a viable tool)
- Contact DataFi to access the "Scam 2.0" course
Additional points:
- New tokens may pose a "High Risk High Return" scenario, suitable for experienced DEX traders.
- Engage in very short-term trading for optimal results.
- Exploring further information is strongly encouraged.
Final remarks:
This comprehensive guide from DataFi is intended to provide you with engaging insights as you explore the various dashboards. We value your contributions, including comments and adjustment suggestions, to enhance quality and uncover unique aspects. We wish you the utmost success in your endeavors.